


11-8-02
12-8-02
13-8-02
14-8-02
15-8-02
16-8-02
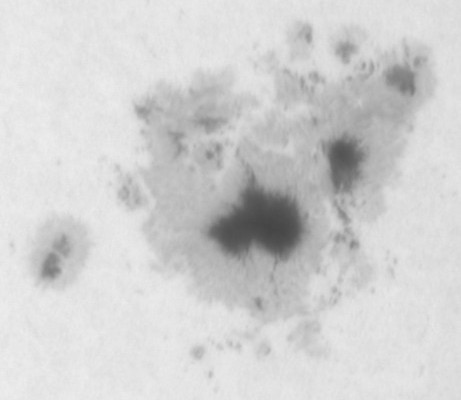
La región NOAA 10069
During August 2002, the Sun offered us an active region of a type that we had not seen for some time. These are groups with rather rounded shapes, very compact and extraordinarily active, where a huge penumbra surrounds most of the cores. They have the magnetic classification Delta, that is, the two polarities within the same penumbra and, in addition, they are inverted according to the Hale-Nicholson law. In the past cycle they appeared with some frequency, but they have been scarce in the current cycle.
|
|
|
|
|
|
11-8-02 |
12-8-02 |
13-8-02 |
14-8-02 |
15-8-02 |
16-8-02 |
 |
 |
 |
 |
 |
 |
17-8-02 |
18-8-02 |
19-8-02 |
20-8-02 |
21-8-02 |
22-8-02 |
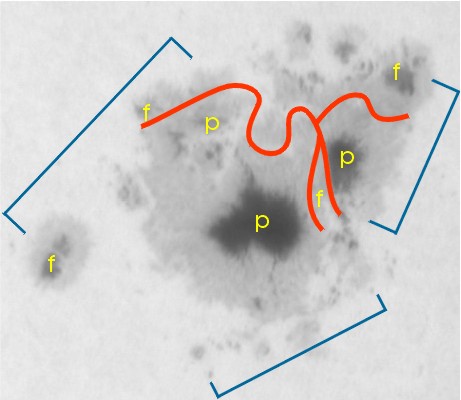
The history of the region can be traced some rotations back, but the spots that were seen in August appeared in rotation No. 1992. In fact, the largest spot appears to be the residue of the group that crossed the meridian on July 21. During its transit through the occult hemisphere, a new emersion occurred in the NE whose region f interacted with it, making it increase in size and activity. On the 14th there were some small spots immediately to the south, and the next day, another more violent emersion began, this time to the northwest. The new polarities were reversed with respect to what Hale's law says. On an image of day 19 I marked with blue lines the three emersions around the central spot (North up, West right). The red line roughly indicates the collision front of the different polarities.
 |
The umbra located at the NW end was moving away with the days but, on the contrary, the two large p-umbra were approached compressing the magnetic fields and causing them to increase their intensity. When a magnetic loop is compressed as soon as it is deformed, it tends to rotate horizontally until it is almost parallel to the neutral line. This process originates two plates of opposite polarities very close, one on each side of the neutral line. Any instability can cause reconnection of the lines of force and trigger a flare. For that reason, most of the great flares occur in these types of groups. In the region that occupies us, the M flares were very frequent, highlighting an X on the 21st.
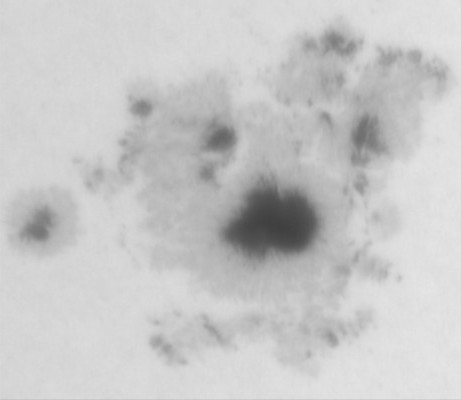
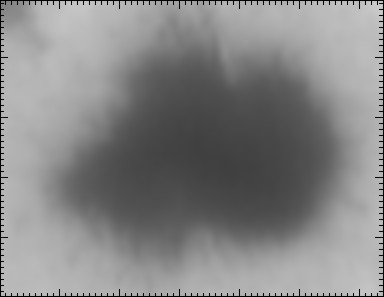
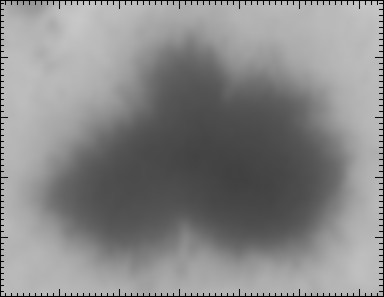
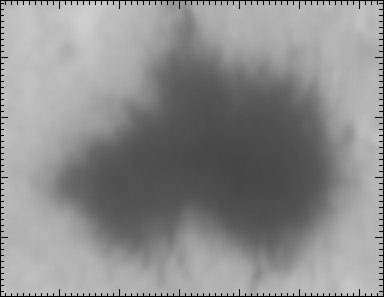
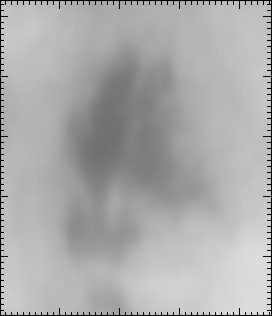
The bad weather this summer prevented an adequate follow-up. However I was able to get three good images, days 17, 18 and 19, and they are the ones used to obtain the photometric maps. Since there is a direct relationship between intensity and temperature, these images can also be considered as thermal maps. Anyway, we must bear in mind that the photos were obtained with a webcam, whose response to the different wavelengths is not very clear. In addition, a filter # 47 was used, which has a transmission band in blue and another in red. This improves the quality of the image but it seems to decrease the contrast somewhat. In addition, we must take into account the dispersion of light produced by our atmosphere, which also tends to soften the contrasts. All of the above means that both the intensities and the temperatures are actually somewhat lower than those that appear on the maps. However, what is sought is to check the variations in consecutive days so the method is perfectly valid.
From the videos obtained in the three days I selected the 15 best frames and, once clean, I added them to increase the signal / noise ratio, resulting in the images below. I ruled out taking the processed further to preserve the ratio of intensities and not to introduce artificial elements that were not originally in the photos (processed images). In each image I obtained the average level of the photosphere around the spots to serve as a reference and to be able to compare the three maps. In this way, all the intensities will be given in relation to said average intensity. The maps have been made by tracing the isofotas and introducing a color scale to facilitate the visualization. The following table gives the relative intensities corresponding to the maximum, minimum isofotas, as well as the difference between two consecutive ones:
Day |
Imax |
Imin |
Dif |
17 |
0.95 |
0.30 |
0.05 |
18 |
0.95 |
0.35 |
0.05 |
19 |
0.95 |
0.30 |
0.05 |
 |
 |
 |
 |
 |
 |
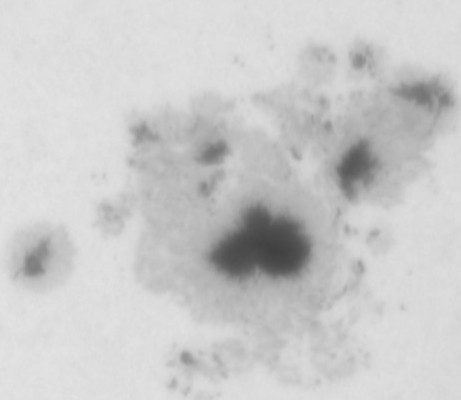
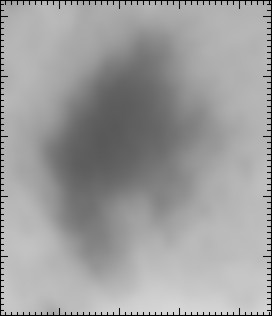
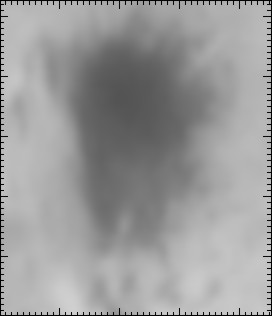
In the maps, several characteristics can be appreciated. First, very irregular isofotas in the penumbra, which is a consequence of the many existing structures in it: pores, light bridges, etc ... The motley appearance of day 19 is because it is the best image and , therefore, in which a greater amount of detail is appreciated. That day also appear details in the photosphere, to the right of the image, due to the greater proximity of the spot to limbus so the intensity in that area is lower. Another circumstance that is not seen at first sight in the images, is the progressive decrease in brightness (temperature) of the penumbra as we approach the nucleus. The intensity varies from 0.95 to 0.7 approximately. Then we find a strong gradient in the boundary between core and penumbra, more or less between 0.7 and 0.5. Finally, in the inner zone of the nucleus the gradients are not as pronounced and the isofotas have softer profiles.
To see more in detail the interior of the main nucleus, I have increased it three times by spline interpolation, obtaining new maps. On the edge scale, each division represents approximately 1 "(734 km). At that distance, our planet would be about 17" in diameter. As before, the table shows the intensities corresponding to the maximum, minimum isofotas, and the step between two consecutive ones.
Day |
Imax |
Imin |
Dif |
17 |
0.500 |
0.300 |
0.005 |
18 |
0.500 |
0.305 |
0.005 |
19 |
0.500 |
0.300 |
0.005 |
 |
 |
 |
 |
 |
 |
The temperature continues to decrease inside the nucleus, although the gradients are much softer than in the umbra-penumbra limit and the profiles are not as irregular as in the penumbra. On day 17 a double thermal well is observed. The next day both centers are separated and one of them increases in size, being the only one that remains on 19. Also, you can see how the incoming that forms to the south seems to strangle the nucleus and, in fact, on the 21st and it had split up because of the formation of a luminous bridge in that area that cut it from north to south.
The minimum intensity recorded during the three days was 0.3 which is equivalent to a temperature of 4300º (about 1500º colder than the photosphere). However, because of the loss of contrast discussed above, this temperature can only be considered as a higher level.
More interesting, if possible, was the nucleus that was formed at the NW of the main one:
Day |
Imax |
Imin |
Dif |
17 |
0.70 |
0.53 |
0.01 |
18 |
0.70 |
0.41 |
0.01 |
19 |
0.70 |
0.37 |
0.01 |
 |
 |
 |
 |
 |
 |
Here we witness the process of forming a umbra. It is known that large spots are formed mainly by fusion of smaller ones and what we see in the image of the 17th are precisely the fragments that would give place, on the 18th, to the umbra already fully formed. Contrary to the previous case, where the temperature remained constant, a progressive cooling is now observed. The minimum intensities are: 0.52, 0.41, and 0.37, equivalent to temperatures of 4900º, 4600º, and 4500º respectively.
This nucleus and the previous one were approached, compressing the magnetic fields between them. It is interesting to see in the image of the 19th, how the small nuclei on the left are elongated in a north-south direction, which coincides with the direction of the collision front. Because of this, the gradients that we find on the eastern edge are much more pronounced than on the west. The following graph shows the intensities of day 19 along a horizontal line that passes through the photometric center (arc seconds on the abscissa). The east gradient is 0.07 Io / "and 0.03 Io /" west. In terms of temperatures, we are about 140º / "east and 60º /" west, approximately (always keeping in mind that these values are higher than the real ones).
 |
The region would return in September in the form of a large H spot, with interesting changes and structures, both outside and inside the main core.
Javier Ruiz