

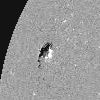
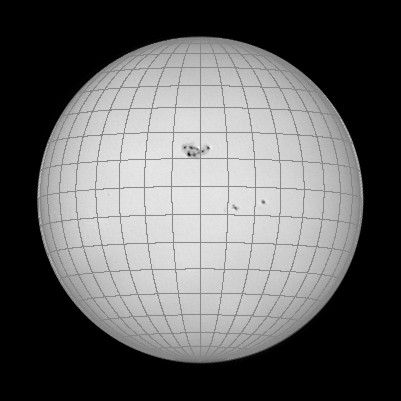
10-1-05
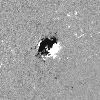
11-1-05
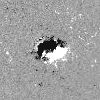
12-1-05
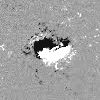
13-1-05
14-1-05
15-1-05
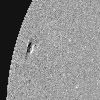
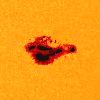
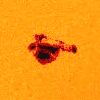
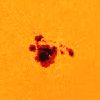
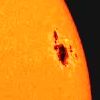
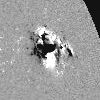
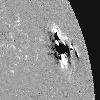
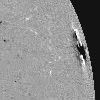
The region NOAA 10720
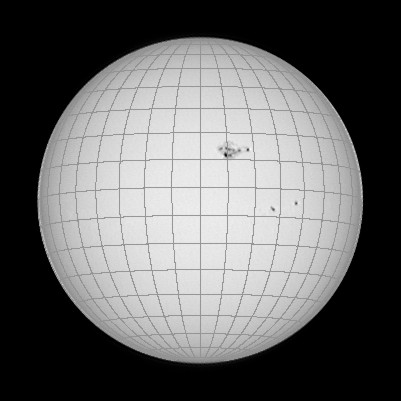
One of the last large delta groups of cycle No. 23, appeared in January 2005. The SOHO images show its development, from its first phases until its hiding behind the limbus, and in the magnetograms, it is seen as the delta configuration (both polarities colliding in the same penumbra) originated almost from the first moment. Two events, perhaps associated, mark the evolution of the group: the ejection of a spot towards the West and a violent emersion that occurred from day 15 in its northern zone.
|
|
|
|
|
|
|
|
|
|
|
|
10-1-05 |
11-1-05 |
12-1-05 |
13-1-05 |
14-1-05 |
15-1-05 |
 |
 |
 |
 |
 |
 |
 |
 |
 |
 |
 |
 |
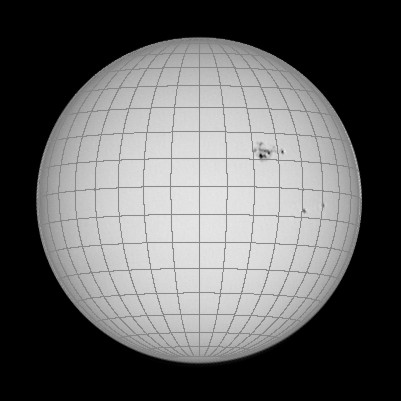
16-1-05 |
17-1-05 |
18-1-05 |
19-1-05 |
20-1-05 |
21-1-05 |
Fortunately, the weather accompanied and I was able to obtain 5 images of the group, between days 13 and 17, while crossing the meridian, and correspond to the most interesting phase of its evolution. You can see them by clicking here. In addition, another 4 images of the entire disk have been used to obtain position measurements:
 |
 |
 |
 |
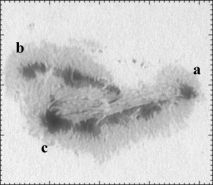 |
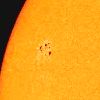
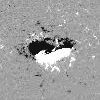
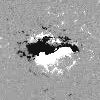
The position measurements have been made on the 3 cores indicated in the photo on the left. The photos of the whole disc, in spite of their size, allow to obtain some errors below 1º. On this occasion, the same nuclei have been measured on SOHO and Big Bear Observatory images and the differences, in all cases, have been less than half a degree heliographic.
The work has been done with Iris, not from the templates, but by measuring the positions of the photometric centers in the image, and then transforming them into coordinates. (See method).
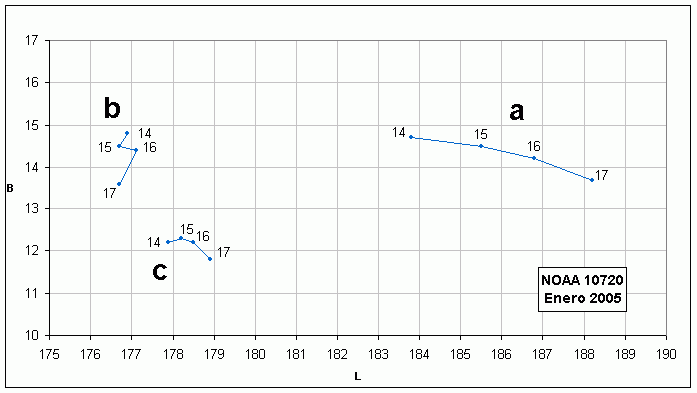
The results appear in the lower graph, where the lengths and latitudes of the nuclei have been represented during the 4 days. The behavior is very different: While b moves to the south and c to the SW, the spot a showed a strong shift to the west. This is the spot that was ejected from the group and, precisely in those days, its movement was faster (as we will see, about 750 km / h).
 |
The movements that appear in the graph are partly apparent, since they depend on the differential rotation. However, this factor can be corrected to isolate, as far as possible, the actual movement and, from it, calculate the speed or the rotation period. For the core the resulting graph is as follows:
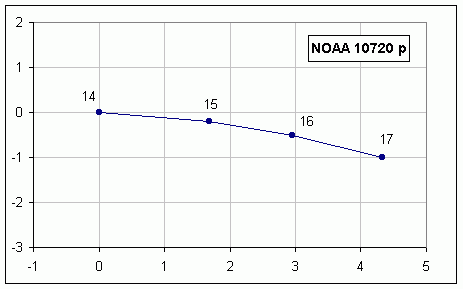 |
In this case, longitudes and latitudes are also represented, but with the origin in the first measurement and having corrected the positions. At a latitude of about 14º the variation with respect to the previous graph is not very large.
The table shows the angular velocity (w) in º / day, the rotation period (T) in days, and the average velocity (V) in km / h, for the three cores.
a |
b |
c |
|
w |
15.6 |
14.1 |
14.5 |
T |
23.0 |
25.5 |
24.8 |
V |
750 |
208 |
150 |
From the photos of days 15, 16 and 17 it has been possible to trace the drift of some details. The measurements made previously on the three main cores, served to properly position the photographs and obtain the velocity field that appears in the figure below (on the image of day 15):
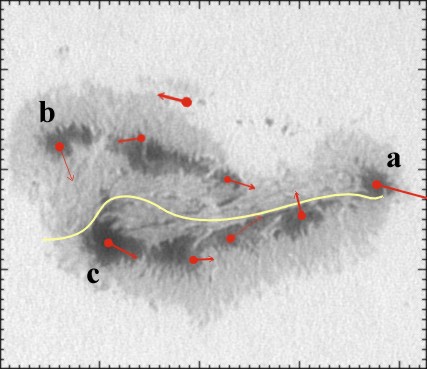 |
The divisions of the scale are separated 5 ", equivalent to about 3,500 km The yellow line indicates the neutral line, which separates the polarities p to the South and f to the North, and the red arrows mark the displacements between January 15 and 17.
The most interesting thing is to check the movement of rotation of the group. Except for the core a and a small one in the center, the rest of the group was turning counterclockwise. This behavior seems to be due to the violent emersion that occurred to the north. As the magnetic field came to the surface it was opening up, displacing the rest of the spots. Meanwhile, the nucleus that remains to the left of the a, with a movement towards the north, was occupying the free space left by the new spots. In the measurements made on the photos of the SOHO it is verified, for example, that spot b undergoes a sudden change of position between days 15 and 16, moving almost 1º towards the south, coinciding with the most intense phase of the emersion. The pressure exerted on the neutral line, especially between cores b and c and east of a, was responsible for the intense flares that occurred from day 15.
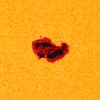
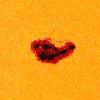
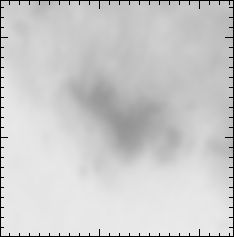
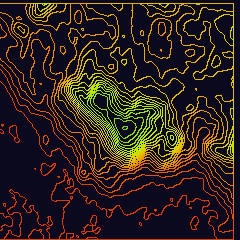
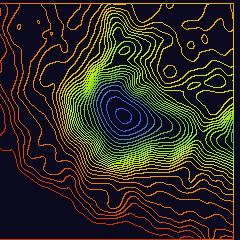
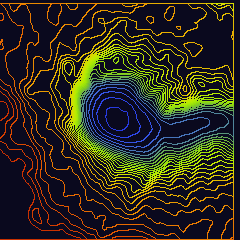
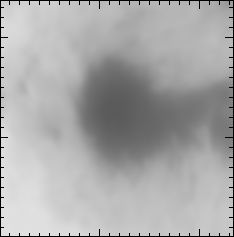
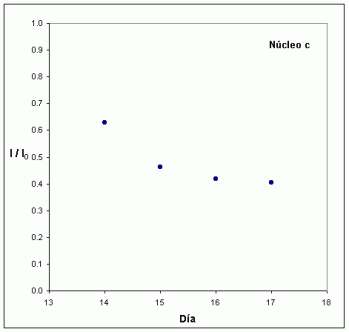
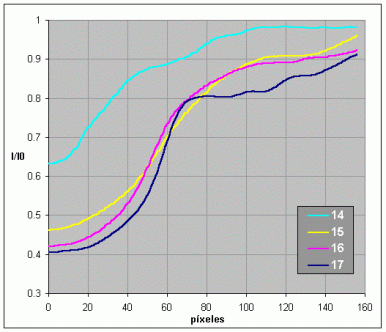
Taking advantage of the fact that the nucleus c was formed in the days in which the photos were taken, its intensities have been analyzed. In the column on the left there are some extensions of the nucleus (days 14-17) as they are obtained after adding the frames. They have not been processed so as not to alter the ratio of intensities. The divisions of the scale are separated 2.5 "On the right are the maps of isofotas or thermal maps.The scale of colors is the same in all the sequence, so that the same color represents the same intensity.
 |
 |
 |
 |
 |
 |
 |
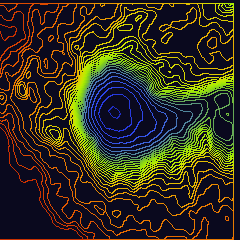 |
The cooling of the core is appreciated quite well as the days pass. The same can be seen in the graph on the left, where the relative intensity with respect to the photosphere of the photometric center has been represented. On the right, the intensity profiles are shown along a line that goes from the photometric center to the zone of the penumbra that remains to the ESE. On the X axis, the distance in pixels from the center, and in the Y, the relative intensity. We can see, not only the cooling, but also how the thermal gradients at the edge of the core become more and more pronounced. This effect is partly due to the perspective, since, as the group approaches the limbus, we see that edge with a greater angle. However, it is also the result of the compression that this area is suffering because of the movement towards the South of the core b.
 |
 |
Javier Ruiz