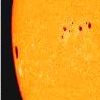
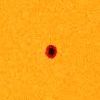
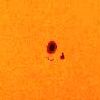
9-3-05
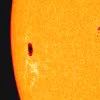
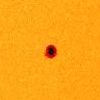
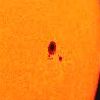
10-3-05
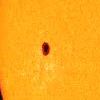
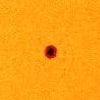
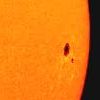
11-3-05
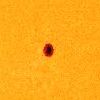
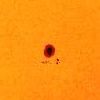
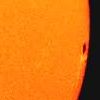
12-3-05
13-3-05
14-3-05
NOAA 10743
History
The spot traveled through the visible hemisphere between March 9 and 21, 2005, remaining with very few variations in its size and structure. The only relevant event was the emersion of a group, on the 16th, at a very short distance, in a southerly direction. This type of secondary formations are very frequent next to ancient spots and can interact violently with them reactivating the whole region. In this case, the evolution of the group was calm and after a few days it began to dissipate.
The few changes suffered by the spot make it an excellent test to check the degree of error that affects the different measurement methods.
You can see a sequence of the spot by clicking here.
|
|
|
|
|
|
9-3-05 |
10-3-05 |
11-3-05 |
12-3-05 |
13-3-05 |
14-3-05 |
 |
 |
 |
 |
 |
 |
15-3-05 |
17-3-05 |
18-3-05 |
19-3-05 |
20-3-05 |
21-3-05 |
Proper motions
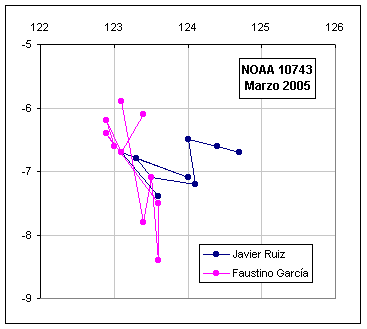
The main feature of this spot was its stability. Below are the position measurements obtained by Javier Ruiz (using photographs) and Faustino García (using a reticle). Faustino's measurements show greater dispersion, but in both cases, the standard deviation remains below 1º. The spot hardly shows displacements, being very difficult to distinguish them from the errors of the measurements.
 |
|
|||||||||||||||||||||||||||||||||||||||||||||||||||||||||||||||||||||||||||
Size and area
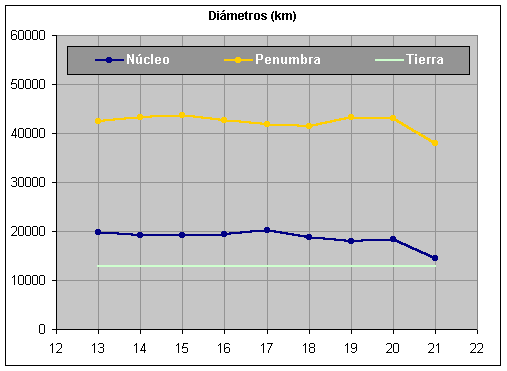
The measurements of the diameter have been made on the major axis of the spot to minimize the effect of perspective as it moves away from the center of the disc. The irregular edge of the penumbra and the umbra-penumbra limit, supposes a serious limitation to the precision of the result. However, except for the last day, the maximum variations are about 2000km. The graph shows the diameters of the nucleus and the penumbra and, as a reference, that of the Earth. The decrease observed on day 21 is due to the opacity of the gases in the vicinity of the limb (q = 63º). It is a phenomenon similar to that produced by the Wilson effect.
 |
|
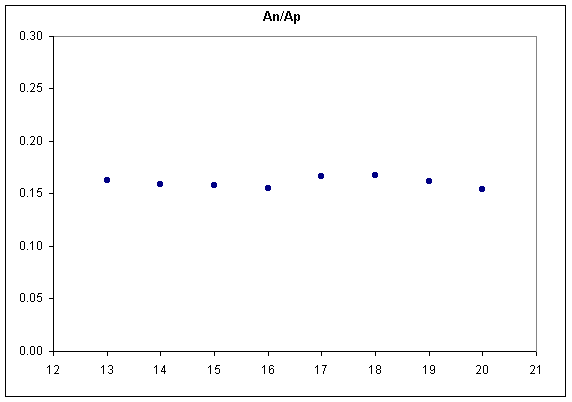
Likewise, the areas of the nucleus (An) and the penumbra (Ap) have been measured in pixels, obtaining then the quotient An / Ap, which informs us of the relative importance of both. An almost constant relationship is observed, which confirms again the stability of the spot. However, there is a jump in the graph, between days 16 and 17. Although the method used was different, in the previous graph you can also see a slight increase in the diameter of the core and a decrease in the penumbra.
Although a cause-effect relationship can not be assured between both events, it should be noted that the jump coincides with the appearance of the new group to the south, suggesting a possible interaction.
 |
Intensities
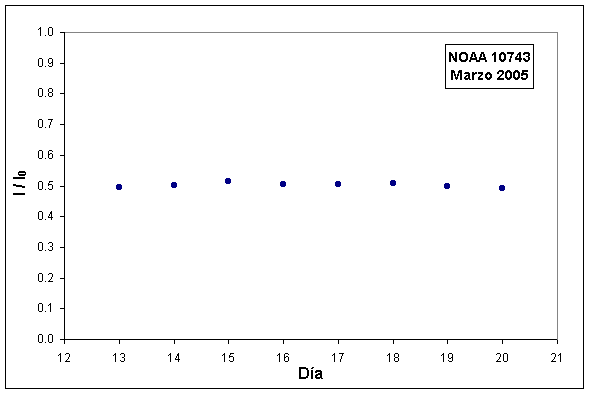
The intensities show, once again, a great thermal stability. The graph shows the relative intensities of the photometric center, corrected by limb darkening. The difference between the maximum and minimum values is only 2% the intensity of the photosphere. This corresponds to a temperature variation of about 200º (always taking into account the limitations of this type of measurements).
 |
Javier Ruiz