NOAA 10756
History
The region does not show any antecedent until the rotation 2028 (the previous one to which we are considering). In that rotation a small bipolar group emerged a few degrees to the E and, despite its proximity to the limb W, it seemed to have a mixture of polarities. We may not find the residue of this group.
The spot already had a good size to emerge from the limbo in the last hours of April 24, although its structure was simple and promised to have a quiet evolution. However, everything changed on day 26 when an emersion of polarity f occurred adjacent to its SE zone. This situation originated a delta configuration, which would remain during the rest of the transit.
Paradoxically, no intense flares were detected. The cause could be found in the location and movement of the spots. These tended to separate the polarities, relaxing the magnetic configuration, contrary to what is usual in these cases.
You can see a sequence of the spot by clicking here.
Proper motions
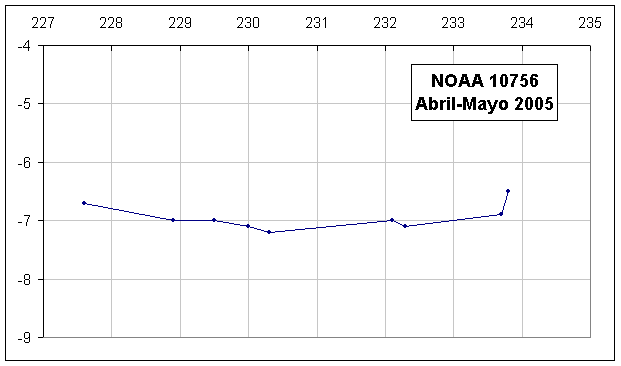
The spot was moving towards the West during its transit, at a practically constant speed and with a latitudinal movement almost nonexistent.
 |
Day |
Long |
Lat |
25-4 |
227.6 |
-6.7 |
26-4 |
228.9 |
-7.0 |
27-4 |
229.5 |
-7.0 |
28-4 |
230.0 |
-7.1 |
29-4 |
230.3 |
-7.2 |
2-5 |
232.1 |
-7.0 |
3-5 |
232.3 |
-7.1 |
5-5 |
233.7 |
-6.9 |
6-5 |
233.8 |
-6.5 |
w = 14.75 º/day
T = 24.4 d
V = 214 Km/h |
Size and area
The spot reached about 64,000 km in diameter, on day 29 (about 5 times the size of the Earth) and with almost 1.5 minutes of arc was easily visible to the naked eye.
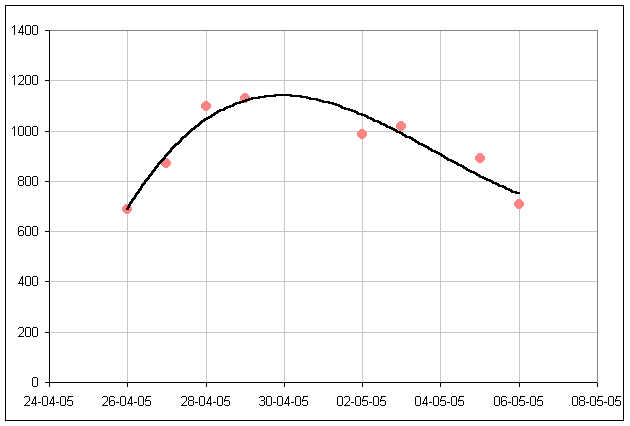
In the first graph, the area of the group is represented in millionths of the hemisphere. The calculation has been made on the isofota corresponding to 0.95 Io (Io = Intensity of the photosphere) for being the one that better delimited the edges of the penumbra. It is observed as the area increases until the 30th day, then decreasing somewhat softer.

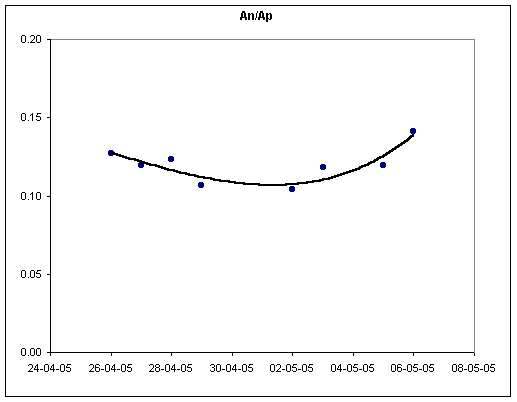
Likewise, the areas of the nucleus (An) have been measured at the level of the isofota 0.7 Io. The quotient between the areas of the nucleus and the penumbra (An / Ap), varies with the evolution of the group. Generally, in the phases of greatest activity, the quotient is lower, because the penumbral area increases proportionally more than that of the nucleus.

Intensities
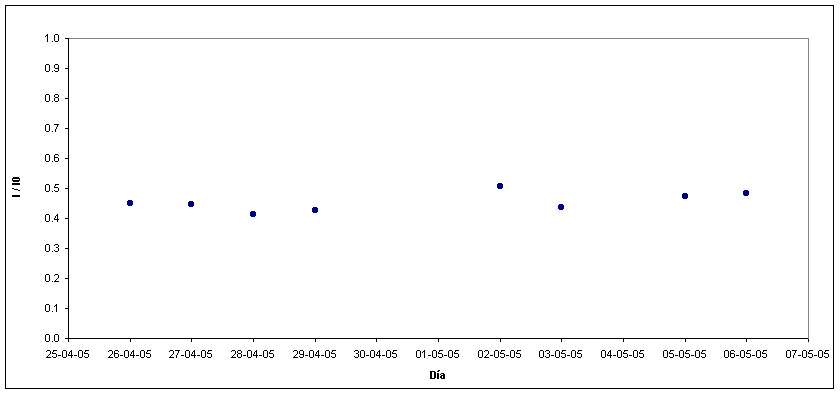
These measures were greatly affected by the observation conditions. The images are very heterogeneous in terms of quality, that originates the jumps in the graph, which are more apparent than real. However, all data except day 2 (the worst image) are in the range between 0.4 and 0.5 Io
Javier Ruiz


