Sequence obtained by Javier Ruiz
30-6-06
3-7-06
5-7-06
6-7-06
7-7-06
8-7-06
NOAA 10898
Sequence obtained by Javier Ruiz |
|
30-6-06 |
3-7-06 |
5-7-06 |
6-7-06 |
7-7-06 |
8-7-06 |
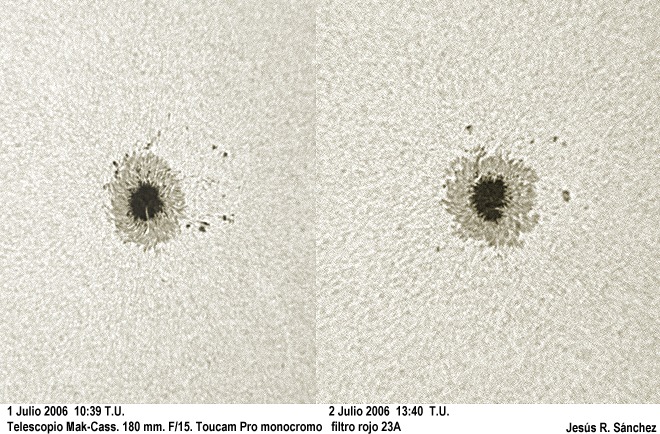
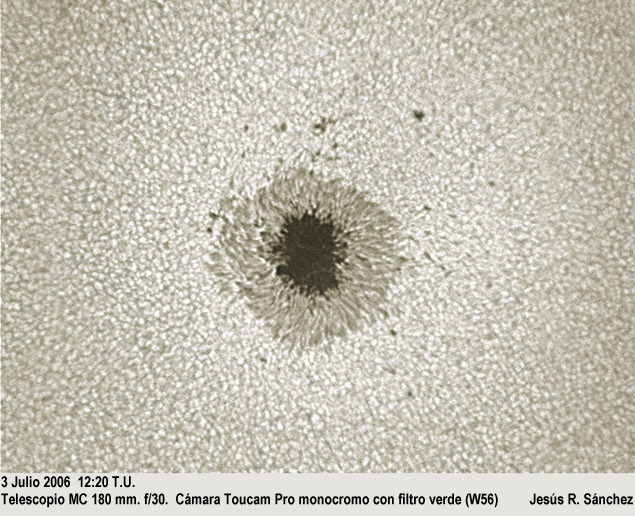
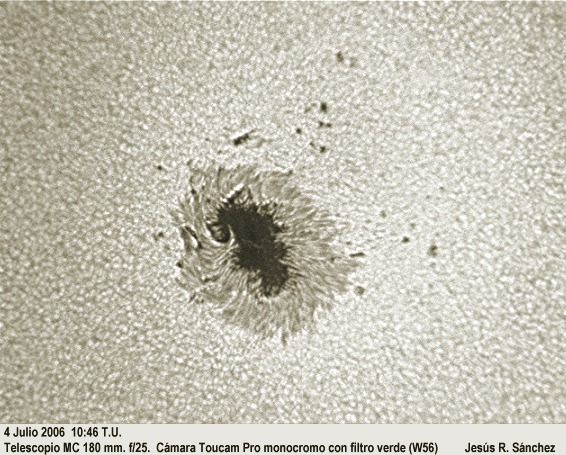
Sequence obtained by Jesús R. Sánchez |
 |
 |
 |
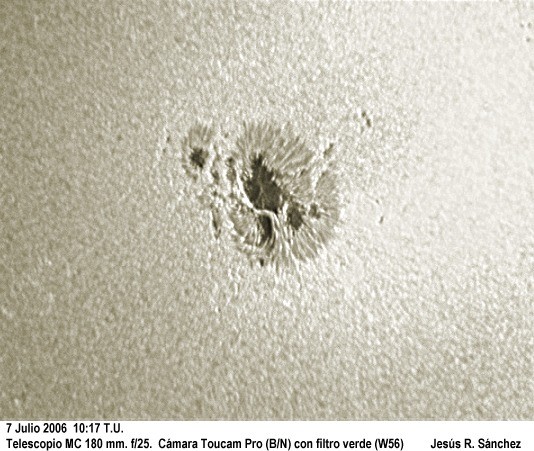 |
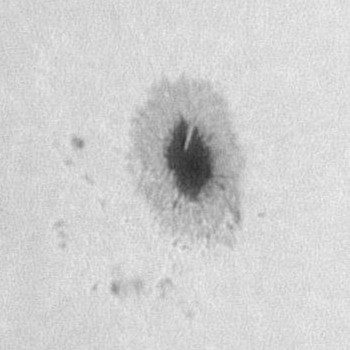
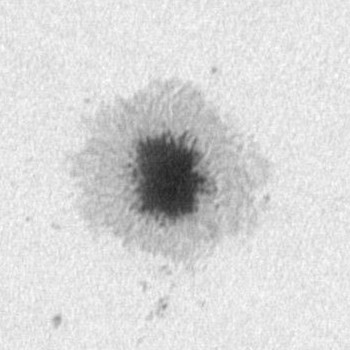
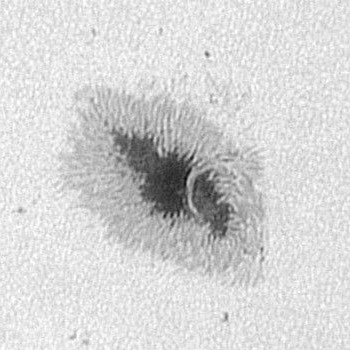
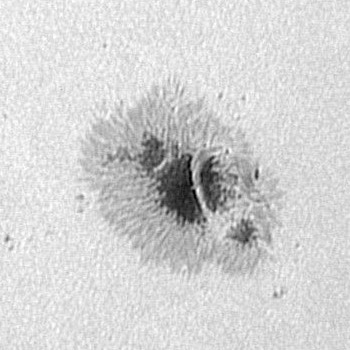
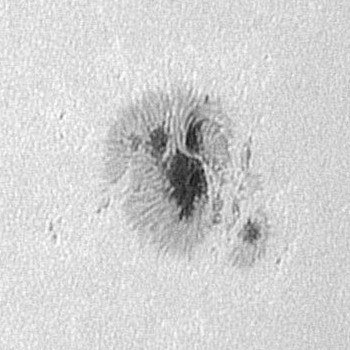
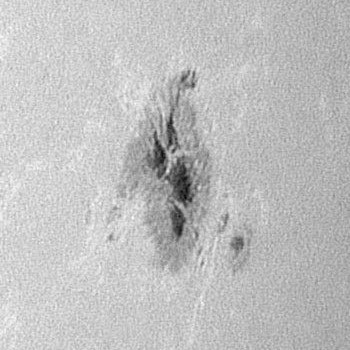
The spot emerged in the east on June 27, in an area that had not shown anything during the previous rotation. At first it was quite symmetrical, with a powerful core and smaller spots around. However, as of day 3, there were 2 processes that may be related. First, the spot was lengthened and the nucleus was divided into 2 fragments separated by a luminous bridge. While the eastern part acquired a "passive" character, the fragment located to the west underwent a second split, quite more violent than the previous one. On this occasion, both pieces behaved as if it were a new bipolar emersion, separating quickly. Interestingly, all the nuclei had the same polarity. The western fragment was ejected from the spot, and the eastern collided with the main nucleus passing it from the north. At the end of this process, the spot was quickly reduced in size, hiding behind the limb on day 10.
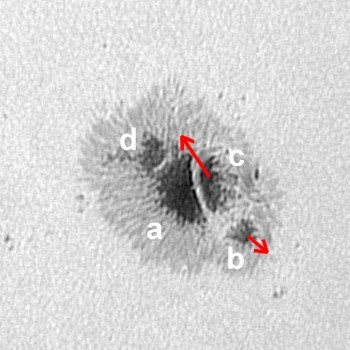
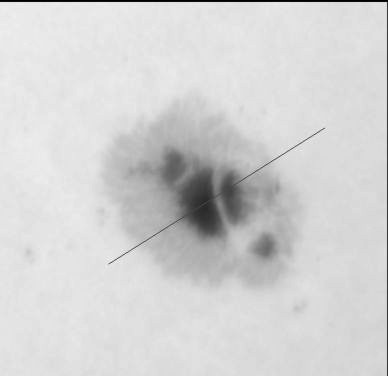
Taking as reference the position of the main nucleus (a), the relative positions of the other 3 nuclei have been measured between days 6 and 7 (when the most important displacements occur). The core d maintains its position with respect to a. The movements of b and c are indicated by arrows. b moved towards the SW at about 230 km / h, while c moved at about 320 km / h towards the NE colliding with a:
 |
The isophotal maps allow us to take a look at the internal structure of the spot. The image of day 30 reveals a very regular spot with concentric isophotes, with the only exception of a luminous bridge that goes deep into the nucleus. However, on day 3 we observed something interesting: the presence of two intensity minima, which could be the beginning of the breakdown of the nucleus. On day 5 the highlight was the increase in temperature. When the image is not good, seeing causes a loss of contrast of the nucleus, but this does not seem to be the case, given that the observation conditions were good. On day 6 the collision of the a and c nuclei takes place, which supposes an intensification of the luminous bridge between them and an increase of the gradients in the zone. After the collision, the core shows more irregular profiles and an increase in temperature.
 |
 |
 |
 |
 |
 |
Making a cut that passes through the minima of a and c can be observed as the greatest intensity / temperature gradients occurred in the luminous bridge:
 |
 |
The lower graph shows the longitude and latitude of the main core of the spot between June 30 and July 8. It is the average of the measurements obtained by Faustino García and Javier Ruiz.
Speed |
200 km/h |
Angular speed |
14.7 º/día |
Period |
24.5 d |
The two following graphs show the measurements of area and relative intensity. It can be seen that the area increases gradually, reaching the maximum on day 6, when the collision nuclei are closer. The intensity measurements are more delicate, but on day 6 a minimum is also appreciated, that is, a lower temperature in the main core.
 |
 |
Javier Ruiz