Rotación Nº 2049
NOAA 10923 - 930 - 935 - 941 - 945
History
This region has been one of the longest we have seen lately. Its activity dates back to October 18, 2006, when pores emerged that only lasted a few hours. A day later there was another small emersion and, on the 20th, just north, a group of rapid growth and rapid dissipation emerged: it almost disappeared before hiding behind the limb, on the 25th, accompanied by another small spot to the west.
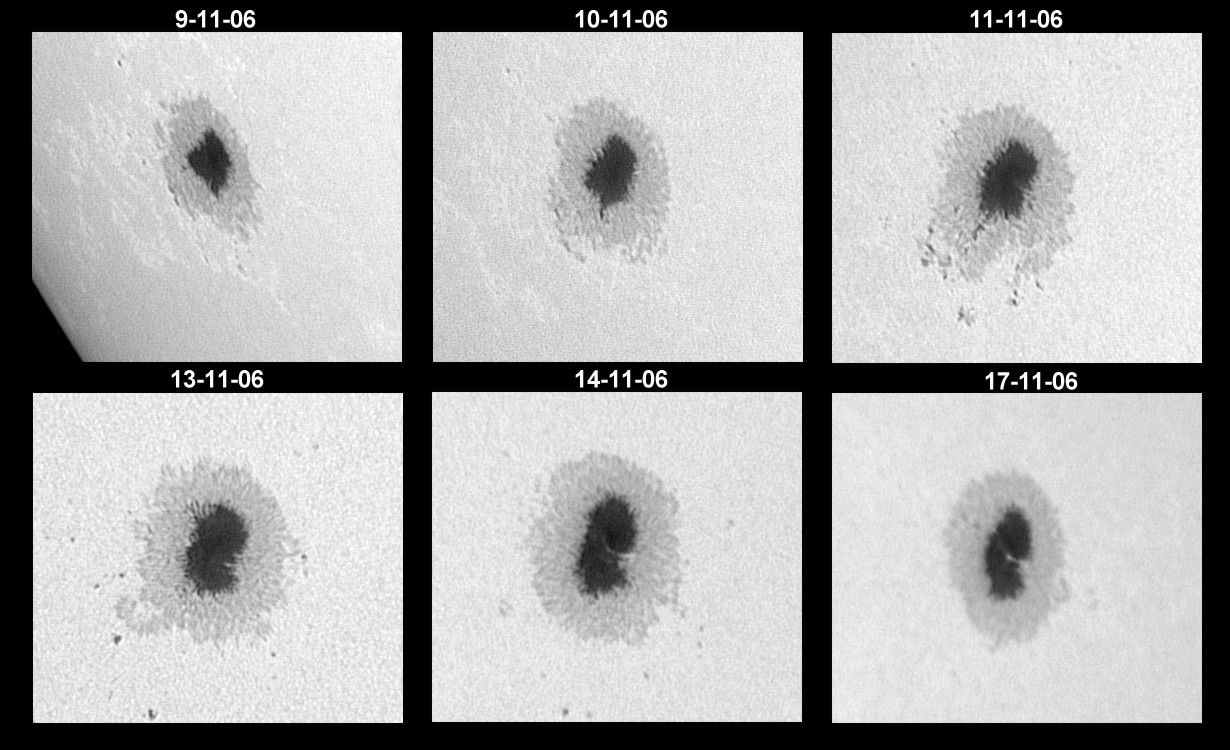
It did not seem that the region was going to give much more game and, nevertheless, November 8 reappeared with a huge spot inside. Besides being big, it was very stable and did not undergo many changes during that rotation. Only it is possible to emphasize the numerous satellite pores that there were to his around at the beginning of the transit (some ejected by the own mancha); and the light bridge that was developed with the passage of the days. Although surrounded by areas of opposite polarity, the spot presented a unique and compact polarity.
Given its size, we expected its return, but this one was more spectacular than anticipated. At first, it seemed to have lost size and activity, but this time the opposite polarity was concentrated to the south and within the penumbra itself, originating a delta configuration that, as we know, is what produces the most active groups. When the spot crossed the meridian it was formed by a large umbra, to the south another smaller umbra with opposite polarity, and some spots and pores around it. The second umbra moved towards the East, but the collision with the first was not frontal but tangential, so that both eventually separated by relaxing the magnetic field.
The spot returned with the beginning of the year, preceded by another very similar and that produced some initial confusion at the time of identifying it. Interestingly, this second spot had a polarity corresponding to the northern hemisphere, despite being located to the south of the equator. Both made their transit almost alone, giving curious images, especially in the magnetogram. The spot we were dealing with had diminished in size, but maintained a remarkable stability with no particularly prominent features.
The rotation 2052 was almost a copy of the previous one, with the only two spots transiting the disc and without outstanding events.
In the rotation 2053 we witness the disappearance of our protagonist. When it appeared in limbo it was already very diminished, almost a simple pore, and we observed it for the last time on February 27. In the following days there were still small emersions of pores, but when approaching the West limb, the facular region had almost dissipated and in the next rotation we barely detected any isolated facula.
Animation made with SOHO photos. Above images in the visible, below the magnetograms.
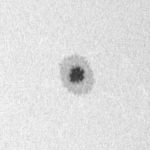
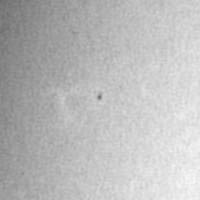
The bad weather and bad images of winter limited us a lot when it came to tracking this region. These are the images that I could obtain in the successive rotations:
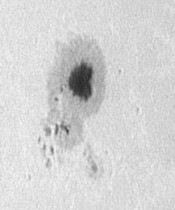
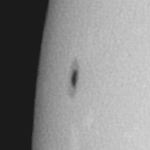
Rotación Nº 2049 |
|
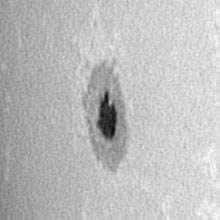
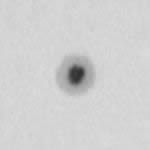
Rotación Nº 2050 |
|||
 11-12-06 |
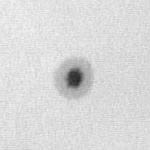
 13-12-06 |
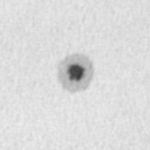
 14-12-06 |
 15-12-06 |
Rotación Nº 2051 |
||
 2-1-07 |
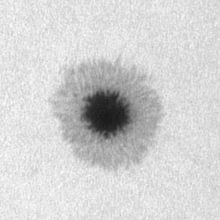 6-1-07 |
 9-1-07 |
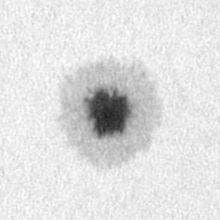
Rotación Nº 2052 |
||||
 29-1-07 |
 3-2-07 |
 5-2-07 |
 6-2-07 |
 7-2-07 |
Rotación Nº 2053 |
 27-2-07 |
Proper motion
The following graph shows the heliographic coordinates of the main core of the spot during 5 consecutive rotations. So that it is not very confusing I have not indicated the corresponding day to each point, although these can be checked in the list. The positions are the average of the measurements made by Faustino García, Juan Pedro Mesas and Javier Ruiz.
 |
Rotation Nº 2049 |
Rotation Nº 2050 |
Rotation Nº 2051 |
Rotation Nº 2052 |
Rotation Nº 2053 |
||||||||||||||||||||||||||||||||||||||||||||||||||||||||||||||||||||||||||||||||||||||||||||||||||||||||||||||||||||||||||||||||||||||||||||||||||||||
|
|
|
|
|
It seems that the spot moved first to the West, then turned South, and finally moved to the East. However, the trajectory of the rot. 2051 is not totally consistent with the trend followed during the two previous rotations. On the other hand, between the rotations 2051 and 2052 it seems that the spot remained almost static during its transit through the occult hemisphere, returning to resume its movement after appearing through the limb.
The solution lies in that the movements that appear in the graph are the result of the own motion of the spot and the differential rotation. Once this last effect is corrected, we only have the proper motion, and the result is quite different (next graph). In this case, heliographic coordinates are also represented, but taking the first measurement as the origin.
 |
During the first two rotations, the spot remains very stable, with a slight shift towards the East. However, after going through the delta configuration, it begins to lose strength and to shrink in size, and its movement towards the East accelerates. Something happened in the rotation 2051 that caused the direction to turn towards the South, while passing through the visible hemisphere, although apparently, it did not suffer visible changes in its structure. Finally he resumed his drift to the East until his disappearance.
Area
The graph shows the decrease in area suffered by the spot since rotation # 2049. A slightly faster size decrease is seen once it exceeds the delta configuration and in the last 15 days.
 |
Intensity
In the first graph the intensity of the photometric minimum of the main umbra is represented, observing a slight tendency to increase the intensity of linear form during the first 4 rotations. Recall that a higher photometric intensity indicates a higher temperature and, usually, a lower intensity of the magnetic field. On the other hand, when a spot decays and becomes smaller, its intensity (temperature) usually increases, so that there is a correlation between the two. However, in the second graph, where intensity is represented as a function of the area, we observe that it remains almost constant except in the last days, that is, that the spot was kept at a low temperature (high magnetic field) even when it had a small size This could explain its longevity, although more examples of long-lived spots would be needed to confirm this behavior.
 |
 |
During the 5 rotations, the nucleus presented a single photometric minimum. The exception was several days of the 2049 rotation, when a light bridge seemed to split the umbra. We could not follow its evolution to the occult hemisphere, but to reappear in the East it showed a unique and compact nucleus (we do not take into account the small spot to the south that originated the delta configuration, having arisen in an independent emersion). The isofotas show the process, first with the elongation of the nucleus and then with the formation of several photometric centers.
 9-11-06 |
 10-11-06 |
 11-11-06 |
 13-11-06 |
 14-11-06 |
 17-11-06 |
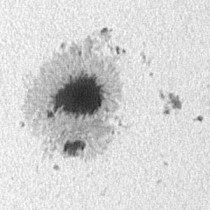
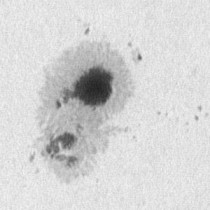
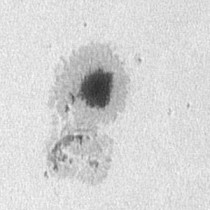
The images of the 2050 rotation show how the small spot to the south breaks and the fragments warm up as they pass the great spot. One of them is ejected towards the SW:
 11-12-06 |
 13-12-06 |
 14-12-06 |
 14-12-06 |
Javier Ruiz