EVOLUTION OF THE ACTIVE REGION NOAA 11092 - NOAA 11101
Jorge Luis del Rosario García
Introduction
The evolution of sunspots and their duration on the solar photosphere is very variable. As a general rule, groups of spots do not survive a solar rotation, that is, they usually do not exceed 28 days of activity. However, some sunspot groups manage to remain visible in the photosphere for more than one rotation.
Observations
Since the beginning of cycle 24, no sunspot had been observed that remained in the photosphere for more than one solar rotation, until the appearance on the east limb of the group of spots in the NOAA 11092 region, so we could consider that this is the first one in the cycle 24.
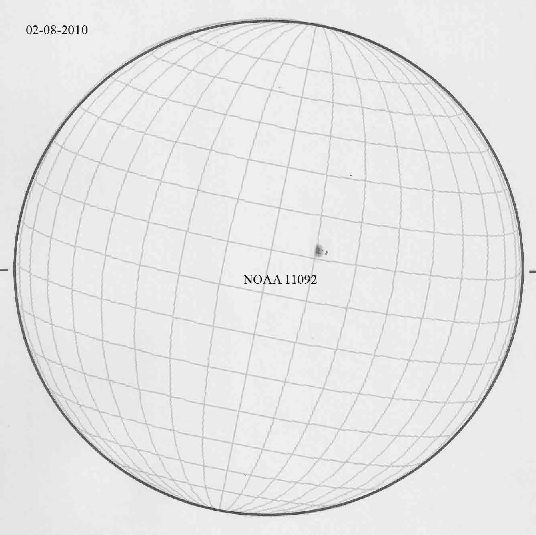
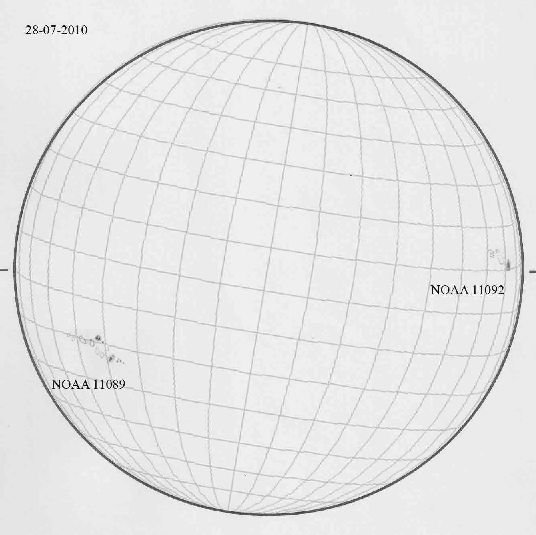
On July 28, 2010, I was able to observe the appearance of a group of sunspots in the NOAA region 11092 according to what can be seen in figure 1, on the 16th day of Carrington's rotation number 2099. Despite the fact that on July 27, 2010 I could also observe, I was not able to see the group of sunspots. It is also true that the quality of the observation that day was not very good, made between clouds and with a light breeze that caused an outstanding turbulence.
The appearance of the group in the visible solar hemisphere shows us that it is quite developed, that is, it did not appear that day since it presented a typology H according to the Zürich typological classification. And of course, the group of spots was surrounded by faculae. Facula were type b according to the Gericke classification.
|
|
|
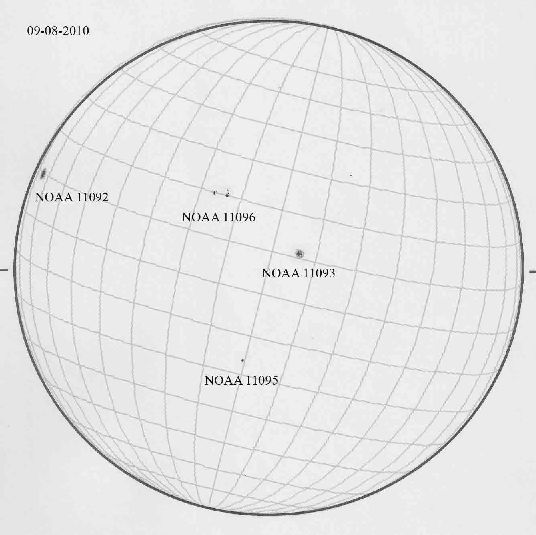
| Fig. 1: Observation of July 28, 2010 | Fig. 2: Observation of August 28, 2010 | Fig. 3: Observation of August 09, 2010 |
The next day, July 29, 2010, it could already be considered a perfect sunspot of type J.
The interesting thing about this region came on August 1, 2010 and especially on August 2, days in which pores appear around it, reactivating the activity of the group of spots again, and can be requalified again as type H, as we can see in figure 2. This reactivation could have been due to a soft "proton event" of <5pfu at 10 MeV produced in the northwest of the region. This explosion came to have a magnetic connection with the Earth.
On August 4, 2010, it was again a pure J type, with no pores to accompany it. Although on August 3, 2010 I could not do the observation, so I do not know if maybe already this day I it had lost that extra activity.
On the 8th and 9th of August 2010, the group could be seen completely surrounded by type a faculae, when approaching the west limb. The group of spots continued unchanged until August 10, 2010, day in which it disappeared through said solar limb, as shown in figure - 3.
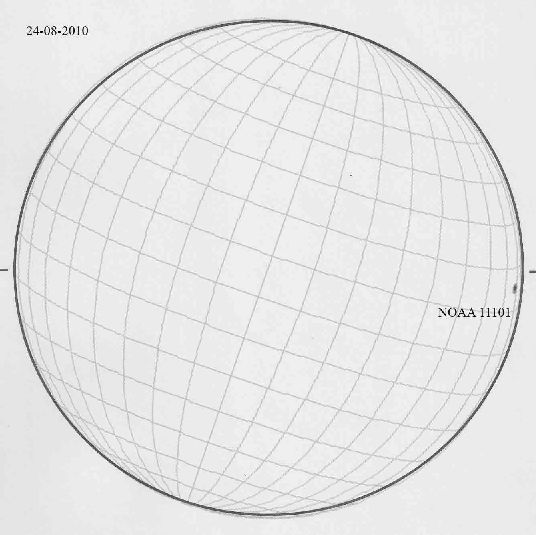
Until August 24, 2010 the group was seen again reappearing through the east limb again as shown in figure - 4, on the 15th day of the Carrington rotation 2100. And of course with the appearance of group type J. This new appearance of the active region was done with the denomination of NOAA 11101.
Due to its latitude and heliographic longitude we can conclude that it could be the same sunspot as the one of the active region NOAA 11092 of the previous rotation.
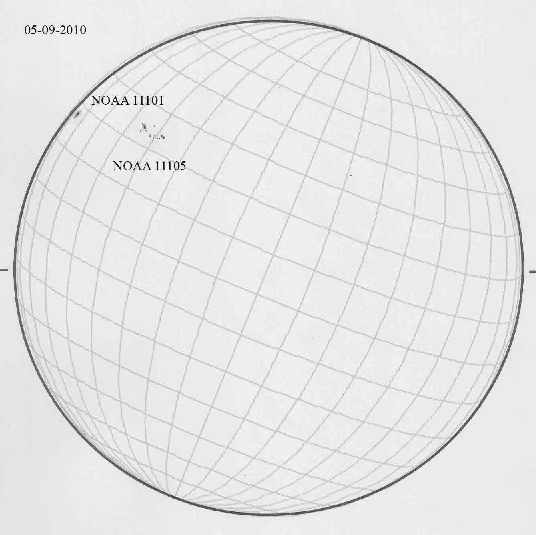
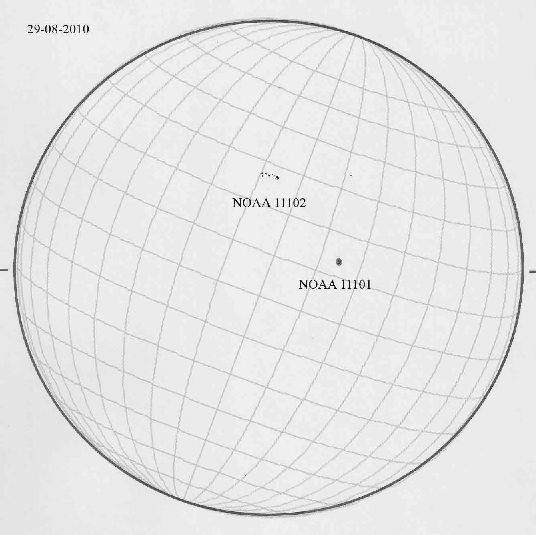
On August 29, 2010, the sunspot NOAA 11101 is divided into two due to a light bridge of type f or type g according to the classification proposed by Hilbrecht. This light bridge could be observed until September 2, 2010. From that day it was no longer possible to observe it, perhaps caused by the Wilson effect that day began to be noticed in the sunspot due to its proximity to the west limb.
 |
 |
 |
| Fig. 4: Observation of August 24, 2010 | Fig.-5: Observation of August 29, 2010 | Fig.-6: Observation of September 05, 2010 |
Finally, on September 5, 2010 the sunspot reaches the west limb disappearing behind it, as can be seen in figure 6, not being observable on September 6, 2010. And of course in previous days he could see the region surrounded by faculae, this time of type a.
The following links shows an animation of this period of activity in the visible hemisphere of the Sun day by day. The first one are my drawings, while the second are the images taken by Javier Ruiz Fernández:
Animation with my observations: animation - JDR.wmv
Animation with the images of Javier Ruiz Fernández: animation - JRF.wmv
Analysis
For the statistical study of the positions of the active regions I have used the data obtained by the different observers who turn their work in Parhelio (http://www.parhelio.com/posic.html). For this particular work, I have taken the data from the observations of the following astronomers:
| Astronomer | Code | Method | Instrumental |
| Faustino García de la Cuesta | FGC | Reticle | T-114mm diaphragmed to 90mm |
| Jorge Luis del Rosario García | JDR | Template + Projection | R-77/1000mm |
| Fabio A. Mariuzza | FAM | Photography | T-130/900mm + Magzero Mz5-C |
| Juan Pedro Mesas Plaza | JMP | Photography | R-60/420mm + Barlow 2x + Olympus E300 |
| Javier Otero Saiz | JOS | Photography | Mak 80/1000mm + Nikon D80 |
| Javier Ruiz Fernández | JRF | Photography | R-100/1000mm + Nikon D40 |
For each day, the heliographic latitudes and longitudes of the group of sunspots obtained by each of the astronomers observed on that particular day are averaged. This average generates a deviation that we will represent through the standard deviation. The days in which there are few observations including mine, the deviation increases a lot because my observation is by projection and with template, so obviously there is a rather large subjective error that makes the observations deviate a lot from what was expected. Depending of the observation there can be errors of up to 2º. The results obtained are represented below in the following graphs:
 |
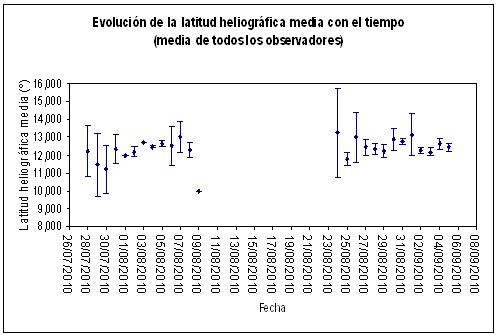 |
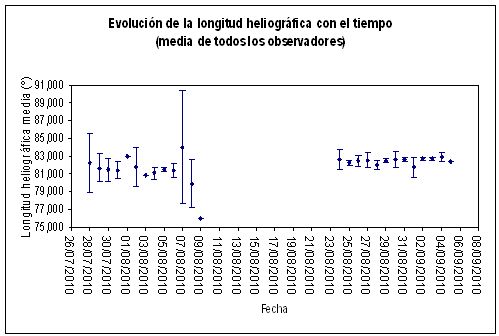
| Fig. 7: Graphs of the variation of the longitude and latitude of the group of spots in the two rotations (2099 – 2100). | |
In the graphs a 15-day interval without observations is clearly shown, this interval is due to the disappearance on the west limb of the active region NOAA11092 (rotation 2099) and the appearance of the active region NOAA11101 (rotation 2100) through the east limb.
We can also verify that the transit of both regions through the visible disk of the Sun lasts around 13 days, the NOAA11092 is on the solar disk from 28-07-2010 until 09-08-2010 and the NOAA11101 is on the solar disk from 08-24-2010 until 05-09-2010. If we add to this transit the 15-day interval between the disappearance of the NOAA11092 region and the appearance of the NOAA11101 region, we have approximately the duration of the solar rotation, that is, about 28 days.
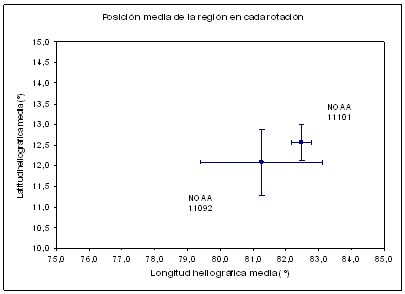 |
| Fig.-8: Average position of both sunspots groups. |
Now we averaged the heliographic longitude and latitude for all the observed days, giving a single pair of coordinates for each active region. In this way we can verify that there is an increase both in the heliographic longitude and latitude, the increase in the longitude is more appreciable than in latitude. When calculating the difference between both active regions we obtain the following values:
Difference in Longitude = 1.22º ± 1.57º
Difference in Latitude = 0.49º ± 0.37º
The problem is that due to dispersion the propagation of the errors in length is greater than the calculated displacement, so the result could be more than questionable, however, even though the propagation of errors in latitude is also high, the displacement in latitude is greater, reason why it can be accepted with fewer objections.
On the other hand, it would be interesting to study the evolution of the activity of the region. For this we will use the areas of sunspots that form the active region.
In this study we have used the areas calculated by Javier Ruiz Fernández, which are on the Parhelio website (http://www.parhelio.com/areas.html) and those calculated by me. We must take into account, as in the previous cases, the subjectivity of the data obtained by me, due to the observation method used. The measurements are taken on the template more or less roughly and are substituted in the following equation:
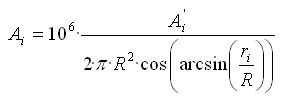 |
Where:
Ai’ = Area measured on the template in millimeters.
ri = Distance from the center of the disk to the center of the spot measured in millimeters.
R = Radius of the template measured in millimeters.
In the following graph we can see the evolution of the areas of sunspots of the regions under study with respect to the passage of days, the areas represented are the measurements by both astronomers and the average of the data for each day.
As expected, the decrease in the area of the spot in its decay is noticeable.
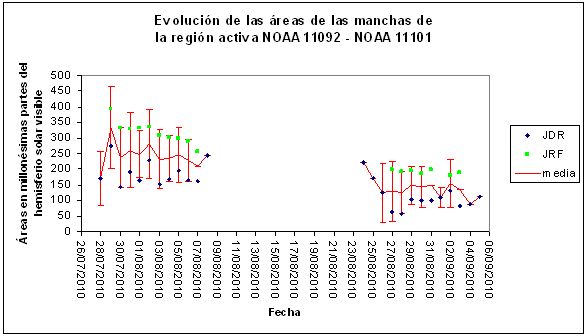 |
| Fig.-9: Variation of the sunspots area. |
Conclusions
Taking into account the heliographic coordinates of the group of sunspots of the NOAA region 11092 and those of the group of sunspots of the NOAA 11101 region we can think that they are the same group, since the tendency of the movement of the group of spots is maintained in the two rotations. On the other hand, the evolution of sunspot group activity keeps its downward rhythm in the two regions, as shown in the graph, which also leads us to think again that it is the same group of sunspots.
In the Carrington rotations 2097, 2098 and 2101 the groups of sunspots that appeared close to the region under study separated from it 10º to 20º, so they possibly belonged to the same active region, but it was not the same sunspot. These sunspot groups belong to the NOAA 11087, NOAA11109 or NOAA11110 regions.
Bibliography: