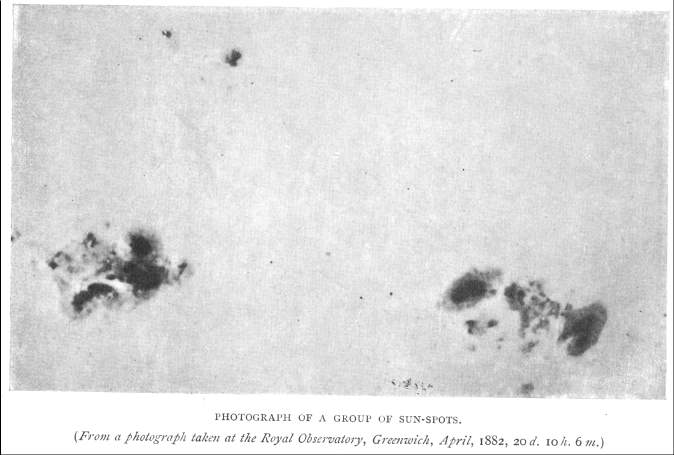
When in 1848, Rudolf Wolf defined the number that bears his name, it was only 3 years since the first solar photography was obtained, and perhaps that is why he leaned towards a simple recount, much easier and quicker to obtain than the areas.
In 1874, the Royal Observatory of Greenwich began a series of measures that would last until 1976, using photographic plates. When its activity ceased, there ceased to be a method that we could qualify as standard, although an important effort has been made to adequately calibrate the series obtained by the different stations.
|
The Rome Observatory covers the years 1958 to 1999, also using photographic plates. The fact that there are 18 years in common between both series, means that the data from Rome can be used as a bridge, to calibrate later series. The areas measured in Rome, are systematically inferior to those of Greenwich, being necessary to multiply them by a factor of 1.15 - 1.25 to make them coincide.
In 1981, the Solar Optical Observing Network (SOON) began its activity, although with a different methodology. Instead of photographs, they use drawings with a diameter of 18 cm, a set of templates with circles and ellipses for the areas and others for the positions. SOON gives more importance to speed than accuracy, trying to keep obtaining data in real time. It must be added that the minimum area considered is 10 mh, which means that SOON discards a large number of small groups and pores, which are precisely the most abundant. However, this has its logic given the difficulty of correctly representing small spots in a drawing of that size, and therefore it can be expected that the areas are systematically below those obtained by other means.
The Observatory of Debrecen, for its part, began its series of measurements in 1977 using white light images. The measurements are made for each group and later, they are added to obtain the total area.
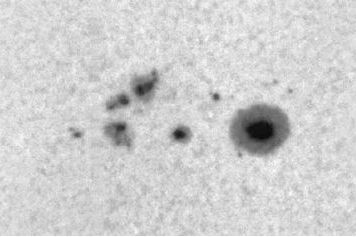 |
Image obtained in Debrecen, on August 2, 1996.
Other stations have also obtained measurements of areas during intervals of several years, and their data is used to complete the gaps in the main series: Kanzelhoehe, Catania, Mt. Wilson, or Yunnan, for example.
The SOON series, both in millionths of hemisphere and disk, can be found at http://solarscience.msfc.nasa.gov/greenwch.shtml
The series obtained in Debrecen can be obtained at http://fenyi.solarobs.unideb.hu/deb_obs_en.html
In the article, the areas of SOON will be called A (SOON), those of Debrecen, A (DPD), and the measurements in Parhelio will be designated simply as A.
It should be noted that the SOON list does not include the raw data. The data provided by the different stations are corrected by perspective and are expressed in millionths of the hemisphere. These data are then multiplied by a calibration factor of 1.4 to make them compatible with the Greenwich areas. The areas in millionths of disk, are obtained later, eliminating the correction by perspective.
While in SOON or Debrecen they use the same images to measure the area of groups and the total area, in Parhelio we use different photographs; and for that reason, it seems logical to separate the analysis into two parts.
MEASURES OF THE TOTAL AREA
If we represent the areas measured in Parhelio with respect to those of the SOON, we obtain the following graph (1). The data cover from June 2009 to December 2012, and sum a total of 690; Logically, excluding those days in which one of the two series lacked observation. We see that there is a correlation between both, with a coefficient of 0.9083. However, there is also a systematic difference of about 20 units between both series.
It is worth mentioning that the slope is slightly higher than that obtained when comparing Greenwich data with SOON data.
Graph 2 shows the relative errors for areas greater than 100 md. The errors range from 50% for small areas, to 44% for larger areas.
In principle, these differences may be due to the type of images or the measurement method. In the case of SOON, it is logical to find the biggest discrepancies when using some images (drawings) and a method (templates) totally different from ours. On the other hand, the fact of discarding the spots smaller than 10 mh can be a fundamental factor that largely explains the differences observed.
 |
 |
Graphs 1 and 2
In graphs 3 and 4 we have used the Debrecen data for the same time interval. In this case, the slope is smaller, and much closer to unity, which means that the areas are also very similar. The relative error decreases with the area, going from 15% to being almost insignificant for the larger areas.
 |
 |
Graphs 3 and 4
Total area - Wolf number
When the activity grows, so does Wolf's number and area, so it makes sense that both quantities are correlated in some way. On the other hand, since neither of them are corrected by perspective, they will present daily variations that are not related to the level of activity, but to the distribution of the spots on the surface. On the other hand, using averages or smoothing with a longer time base, the variations due to the perspective will be compensated. The consequence is that we can expect a better correlation between Wolf's number and the area, using smoothed values.
The data cover from December 2009 to August 2012 and have been smoothed by the formula used by the SIDC: Rs = (R (-6) / 2 + R (-5) + ... + R + ... + R (+5) + R (+6) / 2) / 12
Figure 7 shows our area values (blue), Debrecen (green) and SOON (red), depending on the Wolf number (SIDC). Also included are the respective linear adjustments, and the correlation coefficients.
 |
|
Graph 7
As is logical, when R = 0, the area should also be canceled, and it is interesting to see how, from the three series, the one obtained in Parhelio is not only the one with the best correlation coefficient, but also the only one that passes by the origin (within the margins of error).
 |
 |
 |
Parhelio |
Debrecen |
SOON |
Graphs 8, 9 and 10
By superimposing the areas and the Wolf number, the effect of the different correlation coefficients can be better appreciated. The scales corresponding to the area have been calculated from the settings in Figure 7. At least during this cycle, the measures of Parhelio (8) are better adjusted to the smoothed Wolf number and reproduce their variations somewhat better.
Taking into account the error intervals obtained, our smoothed A values can be obtained simply by multiplying Wolf's number by 20. A relative predominance of the area indicates large groups, but not necessarily numerous. On the contrary, a predominance of Wolf's number implies the presence of numerous groups of small size. A graphic like this, but without softening, can be seen at http://www.parhelio.com/area.html
The measurements of the total area obtained by different observatories are the result of adding the areas of individual groups. These are calculated by adjusting by different methods (gradient, inflection point, etc ...), a line at the edge of the penumbra. On the contrary, in Parhelio we obtain the total area in a single step over the entire disk of the Sun, using global properties of the image, given that the intensity fluctuations produced by the granulation are those that determine the intensity of the cut.
This different approach to the problem does not allow us to correct the areas by perspective, but our intention is to use the total area as an activity index. To make the correction by perspective we use images of individual groups, with greater focal lenght, and therefore, with more resolution.
MEASURES OF INDIVIDUAL AREAS
The measurements of 447 groups of spots made in 2012 are represented according to those obtained by the SOON (graph 11), and their relative errors depending on the area (graph 12). Errors are important, although they decrease from 57% to 33% for larger areas.
 |
 |
Graphs 11 and 12
If we do the same with the Debrecen areas, we get the following:
 |
 |
Graphs 13 and 14
In both cases, the behavior is similar to that of the total area. This data is important because, although the method used in Parhelio to obtain the two types of areas is similar, the type of images is different.
If we represent the errors based on the distances of the groups at the center of the disk, we do not find any apparent correlation, which indicates that the differences between the series are not due to the correction by perspective, which in turn depends on the measurements of position. Therefore, the possible differences that may exist in the positions are small enough to have an influence in the areas:
 |
 |
SOON |
Deebrecen |
Graphs 15 y 16
A determining factor is the scale of the images. The images of individual groups used in this article, in general, have a resolution somewhat superior to those of Debrecen. The difference is usually greater when compared with the images of Kenzelhoehe, Uccle, and Mitaka, used to fill in the gaps in the Debrecen series. An example of the images used:
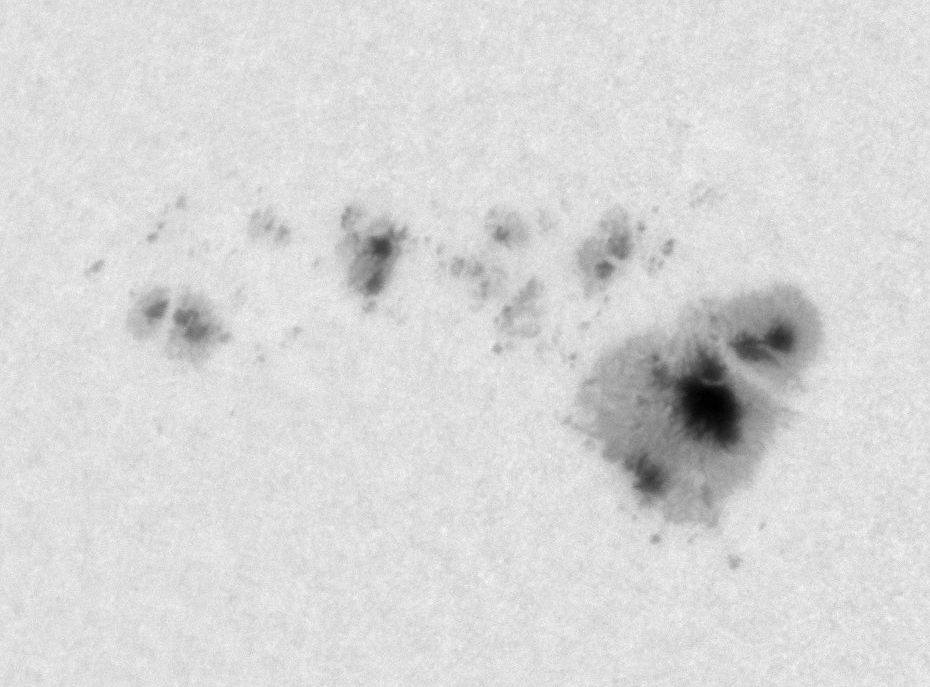 |
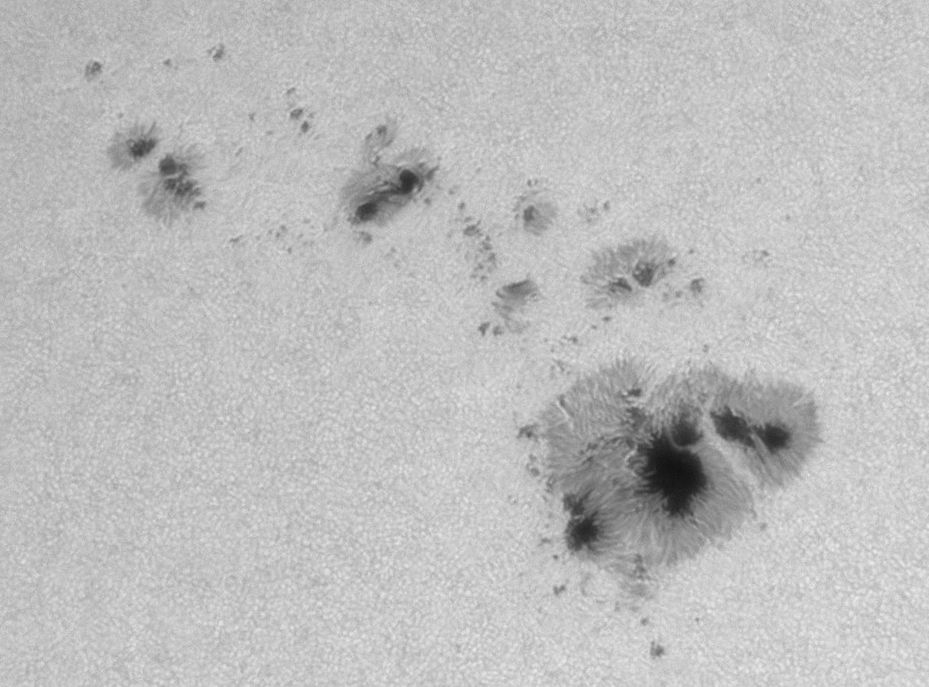 |
Debrecen |
Parhelio |
By not knowing the exact scale of Debrecen's images, we have not been able to measure them to confirm that dependence with resolution. However, this factor could explain the difference of 4% in the slope, since a higher resolution usually produces smaller areas.
Javier Ruiz
Bibliography
L. Győri, T. Baranyi, A. Ludmány: Photospheric data programs at the Debrecen Observatory, Proc. IAU Symp., 273, 403-407, 2011
T. Baranyi, L. Gyóri, A. Ludmány, H.E. Coffey: Comparison of sunspot area data bases, Monthly Notices of R.A.S., 323(1), 223-230; 2001
L. Gyóri, T. Baranyi, M. Turmon, J.M. Pap: Comparison of image-processing methods to extract solar features, ESA SP-508 (Proc. SOHO-11, Davos, 2002), 203-208; 2002
L. Gyóri, T. Baranyi, M. Turmon, J.M. Pap: Study of differences between sunspot area data determined from ground-based and space-borne observations, Adv. Space Res., 34, 269-273; 2004
L. Gyóri: Automated determination of the alignment of solar images, Hvar Obs. Bull., 29, 299-308; 2005
L. Gyóri, T. Baranyi: Comparison of SOHO and Debrecen Photoheliographic Data sunspot areas for the years 1996 and 1997; 2006
L. A. Balmaceda, S. K. Solanki, N. A. Krivova: A homogeneous database of sunspot areas covering more than 130 years; arXiv:0906.0942 [astro-ph.SR]; 2010