H-alpha filters have known a great development and widespread dissemination in recent times. A characteristic of these filters is that they have a tuner, which allows obtaining an image in the center of the H-alpha line. If it were not for the tuner, most days we would not see the center of the line, which is precisely where you can best see the chromosphere. The position of the center depends on various factors, such as temperature.
A tuner can work in different ways. There are some that directly regulate the temperature of the filter; others vary the angle of incidence of the light; and lately, those who control the air pressure in a camera inside the telescope are becoming fashionable.
Now, we can raise the question in reverse. A tuner not only allows to center the H-alpha line, but also to decentralize it. In that way, we can observe the same structures under different aspects, or completely different phenomena.
On April 16 and 17, 2011, I made a first exploration on one of the wings of the H-alpha line, and in this article I show some of the observed characteristics. The instrument used was an SM90 - BF30 from the Observatory of Cantabria, coupled to a Takahashi TSA102 / 816 mm, and a DMK31. The tuner consists of a screw, with which the inclination of the filter can be varied, and therefore, the angle of incidence of the light.
The previous system is very comfortable, but it has two drawbacks. First of all, in the filter that we have in the Observatory, the center of the line is approximately 1/5 of the screw's travel, which means that only one side of the line can be effectively explored. It remains pending confirmation if it is the blue wing or the red wing. On the other hand, the displacement can not be quantified, although the appearance of the images suggests a distance of a little more than 1A from the center of the line, when we take it to the extreme.
In the previous graph we can see the profile of the H-alpha line. In the center it reaches 20% of the intensity of the continuum. When we move from the center, the first thing we notice is an increase in intensity, saturating the camera and forcing us to reduce exposure. This is because the chromosphere is more transparent at these wavelengths, and allows more light to pass from the photosphere. It is as if we had a filter in front of the telescope, and it became less dense.
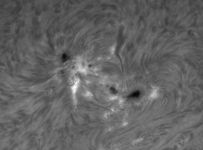
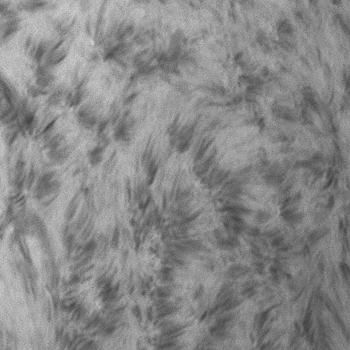
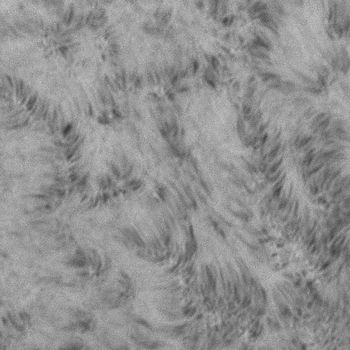
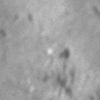
As we move away from the center, the most important thing is that we observe layers of the chromosphere deeper and deeper. We lose sight of the higher structures, and appreciate more clearly the basis of them. Finally, at the end, we can see the spots with a similar appearance to that in white light, and very faintly, the characteristic features of the chromosphere.
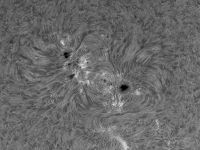
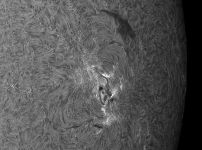
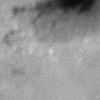
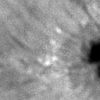
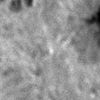
In the following animations we can check the appearance of two active regions at different distances from the center of the line. All of them except the first, consist of 5 frames. In the three of the 16th we are moving from the end to the center; and on the two of 17, from the center to the end. The first has an additional frame corresponding to the opposite wing. I have added it to show the important change of appearance, on both sides of the center, of the filament located to the north of the group of spots. On the other hand, the most distant images present vertical bands because the flat obtained in the center does not serve for the ends.
| 16-4-11 | ||
 |
 |
 |
| 17-4-11 | |
 |
 |
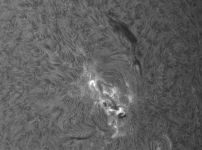
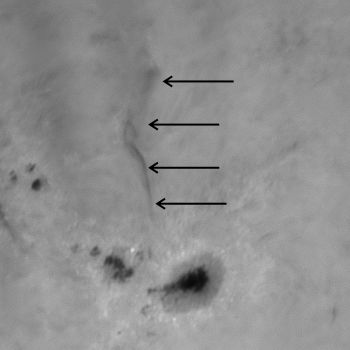
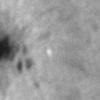
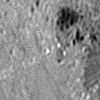
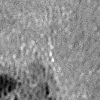
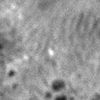
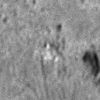
In reality, these images are the result of the superposition of two effects: on the one hand, the observation of layers at different heights, and secondly, the Doppler effect. If there is material moving so that one component of the velocity coincides with the visual, that material will not be seen in the center of the line but on one of its sides. If the speed is high enough, it can be observed in the images at a greater distance. Let's see some examples:
 |
 |
 |
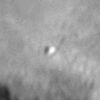
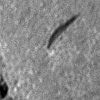
The third image corresponds to a "surge" that evolved in a very short time, which confirms a very high speed.
These details are as absorbing as if they were in the center of the line, but the chromosphere becomes so transparent that it practically disappears, and for that reason they can be observed with great contrast. The same can be said of the spicules: from 0.5A they appear isolated, and of dark color on a light background. With a filter that allows us to explore both sides of the line, we would check that its appearance is different, which indicates that it is also a Doppler effect.
 |
 |
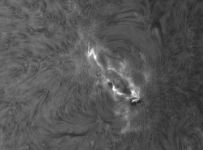
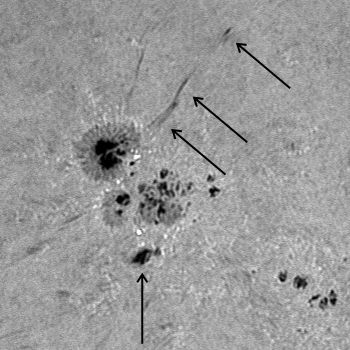
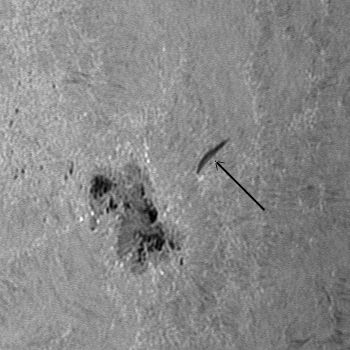
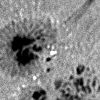
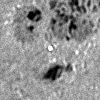
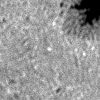
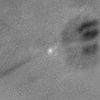
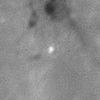
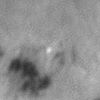
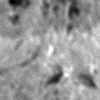
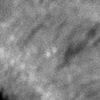
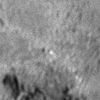
All these characteristics can be observed to a greater or lesser degree, or in various circumstances, in the center of the line; but there is a phenomenon that can only be seen in the wings: the Ellerman bombs. Some authors use the word "moustaches", precisely alluding to the fact that, in the spectrum, they appear as an emission band on each side of the line with an empty space in between. This circumstance means that they reside in the low chromosphere. Sometimes the two bands are asymmetrical, which reveals ascending or descending movements at high speed.
Although its main characteristics are known, its origin remains unclear. In the images appear as small bright spots, with an average size of 1 " approximately, and showing a greater intensity at a distance around 1A from the center of the line.The maximum intensity can be higher than 70% of the background. Distribution is not random, but is usually concentrated around the spots and in regions where magnetic field emersion is taking place.
In the following images I have selected some of the most relevant ones, although many others can be observed in the environment of the spots.
 |
 |
 |
 |
 |
 |
 |
 |
 |
 |
 |
 |
 |
 |
 |
 |
 |
 |
 |
 |
Javier Ruiz