H-alpha |
LATITUDES OF PROMINENCES
 |
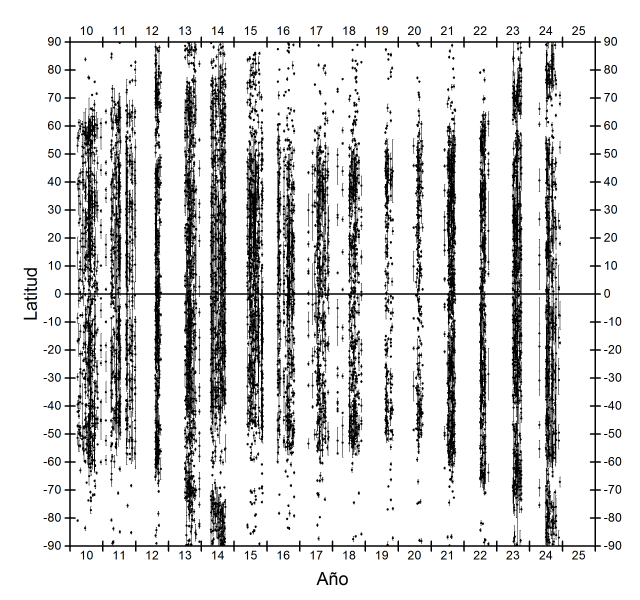
In the graph, the points represent the latitude of the center of each prominence and the error bars, its north-south extension. It is similar to the Maunder diagram, but prominences are represented instead of spots. The text file with the data contains three columns: the day of the observation, the latitude of the prominences and its extension, these last two in degrees. The data has been obtained by Javier Ruiz.
The appearance in the form of vertical bands is due to the fact that the program is being developed at the Observatory of Cantabria, and most of the measures are grouped in those months in which the Observatory is open to the public.
The interpretation of the graph can be found at http://www.parhelio.com/en/polar.html. The limit latitude at which the prominences arrive indicates the size of the polar caps. During the minimum, they reach their maximum extension, up to 55 ° latitude. When the cycle begins and groups of spots appear more and more frequently, the caps are reduced in size and the prominences move towards the poles. During cycle 24, this migration began in 2009-2010, in the north, and the prominences reached the pole in mid-2012, at which time polarity reversal occurred in that hemisphere. In the south, migration began in 2011 reaching the pole in 2013. This lag is similar to that presented by both hemispheres in other activity indices such as Wolf's number or area. Since 2015, the limit latitude is again at 55º. The few specimens of prominences that have been observed at more latitude are very small and it is probable that some are actually macro-spicules.
A secondary result of these measures is to be able to track the number of prominences and their extension throughout the cycle. In the left graph the number of prominences observed each day is represented. Although the dispersion is high, a variation with the cycle can be detected. The maximum was reached in 2013-2014, with about 18 prominences on average, and since then it has been decreasing to about 12 at the minimum (33% less). On the right, the dimensions measured each day are represented. During the 2014 peak it was relatively frequent to observe specimens that exceeded 20º, while in 2018, at minimum, almost all were below 15º.
 |
 |
PROMINENCE COUNT
The following graph shows the number of prominences (P) obtained according to the formula defined by Peter Völker (similar to the definition of Wolf's number):
P = 10 * H + E
where E is the number of individual structures and H the groups of protuberances. The data has been obtained by Javier Alonso.
 |
The data list contains the following columns: the month in YYYYMM format, the monthly averages in the northern, southern hemisphere, and the total; and the smoothed values, also in the northern, southern hemispheres, and total.